
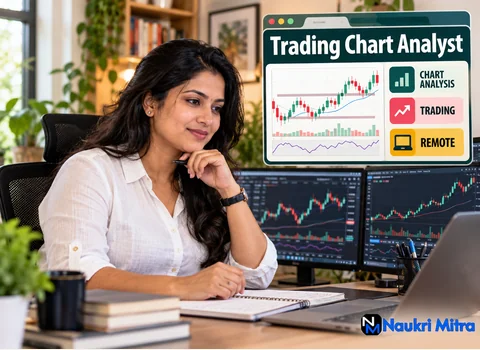
A horizontal line sits across the daily chart at a price where the market has turned several times. Each touch looks convincing on its own. The analyst's real question is quieter: is this genuine support, backed by volume and visible on more than one timeframe, or is it a pattern the eye wants to see because three wicks happen to line up? Doubting your own first read is the habit at the centre of remote trading chart analyst jobs, and this full-time position is built around it. The role is a Trading Chart Analyst, working from home anywhere in the world, paid $600 per month (USD).
Put simply, the trading chart analyst job description in this listing has four parts. You analyse charts on TradingView or MetaTrader for candlestick patterns, indicator readings and support and resistance levels. You prepare daily technical outlook notes. You backtest setups. You present your findings to the research or content team. None of that involves managing money, taking trades for clients or sending calls to the public.
A chart analyst and a technical research analyst both study price and volume rather than balance sheets. In common usage, a chart analyst produces observations and setups that feed an internal process, while a technical research analyst usually publishes research reports or recommendations under their own name, which in India brings SEBI registration rules into play. This listing describes the first kind of work, with output going to an internal team.
Brokers, research houses and financial content businesses are the kinds of organisations that use this skill; they are named to describe the field, not as the employer of this post.
Candlestick patterns are useful shorthand for what buyers and sellers did inside a session. A hammer after a decline, a bearish engulfing bar at a prior high, a doji after a long run: each says something about pressure and hesitation.
A disciplined reading asks where the pattern formed, what volume did, and what the next session confirmed. An engulfing bar mid-range is noise; the same bar at a tested level on rising volume deserves a line in the notes.
Moving averages, RSI, MACD, Bollinger Bands and volume studies are derived from price, so they cannot show anything price has not. Their value is in summarising it: trend direction, fading momentum, contracting volatility.
Keep the set small and the settings stable; stacking oscillators that measure the same thing gives false confidence. Changing an RSI period because the default did not suit last week's chart is the start of curve-fitting. Among core trading chart analyst skills, restraint with indicators ranks close to reading them correctly.
Support and resistance are better thought of as zones than thin lines. The analyst marks where earlier reactions clustered and how often the area was tested. Broken resistance that later acts as support is a widely watched observation in charting, though it is never certain.
Multi-timeframe analysis is the check against tunnel vision. A level on a fifteen-minute chart means little if the weekly chart shows price sitting in open space between major zones. Start on the weekly or daily for context, then step down for structure and detail. When timeframes disagree, the note should say so plainly.
The listing asks for expert use of one of these three.
Backtesting a setup means defining entry, exit and invalidation rules precisely, then running them over historical data to see how they would have behaved. The risk is curve-fitting: adjusting parameters until the past looks perfect, which tends to produce a rule that only works on the data it was tuned on.
Ways to guard against it include:
A backtest describes the past under stated assumptions. It is not a forecast, and the reports you share should say that.
Each day you prepare a technical outlook note for the internal research or content team. A useful note is short and structured: the instruments covered, the timeframe, key zones, what the indicators show, and the conditions that would prove the view wrong. It reads as analysis, written to be checked, not as a call to act.
Two sets of rules from the Securities and Exchange Board of India matter here: the SEBI (Research Analysts) Regulations, which cover research, and the SEBI (Investment Advisers) Regulations, which cover advice. Anyone who puts specific buy or sell recommendations in front of the public needs SEBI registration to do so. Explaining how a pattern or indicator works is education, which is different from advising someone what to do with their money. Anything the team chooses to publish from your notes as a recommendation is subject to SEBI rules, and that decision sits with them. You will not be sending tips or promising returns to anyone.
Presenting means walking the team through charts and test results, separating what the data shows from what you suspect, and taking challenges calmly.
This listing prefers candidates who hold NISM Research Analyst certification, which comes from passing the NISM Series XV exam set by the National Institute of Securities Markets. Under SEBI rules, individuals doing research analyst work for a registered entity are generally required to hold this certification, so it is a sensible trading chart analyst certification for anyone in the Indian market.
The CMT, or Chartered Market Technician, is a plus. It is awarded by the CMT Association after candidates pass three levels of exams on technical analysis theory and application and meet professional experience requirements. Some candidates pair the official curriculum with a structured trading chart analyst course.
The listing expects two or more years of hands-on technical analysis. For anyone wondering how to become a trading chart analyst without that history, the honest route is to build it. Keep a dated chart journal, paper-trade or record setups without real money, study for NISM Series XV, and keep a portfolio of past outlook notes you can show. A trading chart analyst resume is far stronger with dated analysis an interviewer can examine.
The listing also names a multi-monitor setup as ideal. Extra screens keep higher and lower timeframes side by side. A dependable data feed matters too. Broker-provided feeds and licensed vendors differ in quality, history depth and whether data is real-time or delayed, and your notes should reflect what you were actually looking at.
As for trading chart analyst salary per month in this listing, the full-time post pays $600 per month (USD). This listing mentions no commissions, profit share or bonuses. Since the location is open, it sits among trading chart analyst jobs remote worldwide, and like other trading chart analyst work from home jobs it depends on your own discipline and setup.
Finance is a favourite area for fake recruiters. No genuine analysis team wants money from you first, whether that is a training course fee, a signal subscription, a deposit into a trading account or a registration charge. Be wary of profit screenshots offered as proof, requests for your broker login, or a role that means pushing tips into Telegram or WhatsApp groups. A genuine desk role pays you for analysis and asks for nothing up front.